
[BigData] 01
Published:
In this post, lecture 01 of BigData math is introduced.
01 Vectors
pyplot.quiver : 벡터장(vector field)을 화살표로 시각화할 때 사용하는 matplotlib 함수.
import numpy as np
import csv
import matplotlib.pyplot as plt

plt.quiver([0], [0], [2], [4], angles='xy', scale_units='xy', scale=10)
plt.xlim(-5, 5)
plt.ylim(-5, 5)
plt.show()
read_file :
def read_file(file_name): results = [] # csv의 각 row를 저장할 리스트 with open(file_name, newline='') as csvfile: idx_reader = csv.reader(csvfile, delimiter=',', quotechar='|') for row in idx_reader: results.append(row) return results sp_idx = read_file('../data/sp500_idx.csv') sp_idx = np.asarray(sp_idx) closing = np.asarray(sp_idx[:, 6], dtype=float) print(closing.shape) # 6:7이 아니라, 6으로 정수 인덱싱을 사용했으므로 shape이 (1, 7803)이 아닌 (7803, ) 이 됨. closing = closing[::-1] # 슬라이싱을 이용한 배열 뒤집기 plt.plot(closing) # x축은 배열 길이만큼 표현, y축은 closing 값. plt.show()- with open : CSV 파일을 열 때는 항상
newline=''을 사용할 것. - csv.reader : 인자로 주어진 csvfile을 한 줄씩 읽어주는 iterator를 반환한다. 각 반복에서 반환되는 것은 str들의 list이다.
delimter=',': csv의 row의 문자열을 구분하는 구분자이다.quotechar='|':… 아느이 쉼표는 구분자로 취급하지 않는다. 즉, 하나의 row가 “2020-01-02, 3,257.85 ” 이라면 첫 번째 iteration에서 [‘2020-01-02’, ‘3,257.85’] 이 반환된다.
np.asarray(x):x를 NumPy 배열로 변환하되, 이미 ndarray면 그대로 반환하고, 필요할 때만 새로운 배열을 만든다.
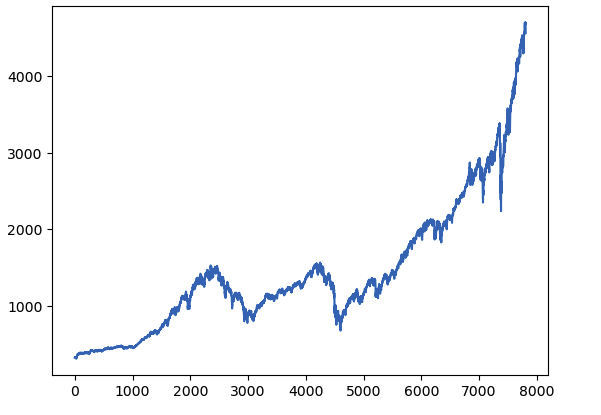
- with open : CSV 파일을 열 때는 항상
02 Vector addition and scalar multiplication
vector addition code :
v = np.asarray([2, 0])
w = np.asarray([0, 4])
vw = v + w
plt.quiver([0, v[0], 0], [0, v[1], 0], [v[0], w[0], vw[0]], [v[1], w[1], vw[1]], angles='xy', scale_units='xy', scale=1)
plt.xlim(-1, 8)
plt.ylim(-1, 8)
plt.show()
print("The length of v+w is ", np.sqrt(np.dot(vw, vw)))
plt.quiver(X, Y, U, V)(X[i], Y[i]): i번째 화살표의 시작점(U[i], V[i]): i번째 화살표의 벡터 성분(방향+길이)
04 Linear Regression
sklearn linear regression training
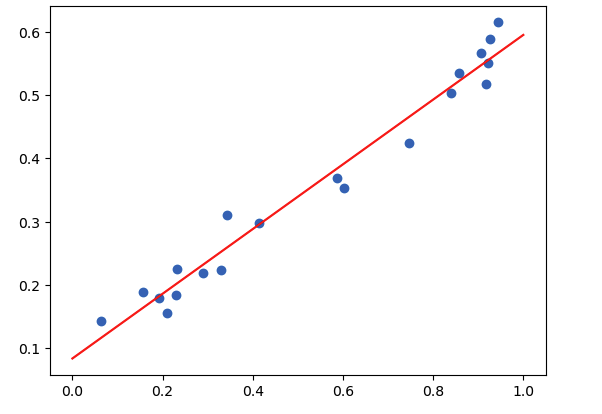
from sklearn.linear_model import LinearRegression N = 20 xs = np.random.rand(N) ys = 0.5*xs + 0.1 + 0.1 * (np.random.rand(N) - 0.5) model = LinearRegression() model.fit(xs.reshape((-1, 1)), ys) # xs.shape은 (20, ) 이므로 이를 (20, 1)으로 reshaspe a = model.coef_ b = model.intercept_ plt.scatter(xs, ys) plt.plot([0, 1], [a*0 + b, a*1 + b], c='red')- xs.reshape((-1, 1)) 을 하는 이유는 scikit-learn은 입력 X를 항상 2차원으로 요구하기 때문이다.
08 K-means Clustering
Setting for K-menas Clustering
import gzip #f = gzip.open('t10k-images-idx3-ubyte.gz', 'r') f = gzip.open('../data/MNIST/raw/t10k-images-idx3-ubyte.gz', 'r') image_size = 28 num_images = 10000 f.read(16) # read and ignore header buf = f.read(image_size * image_size * num_images) f.close() data = np.frombuffer(buf, dtype=np.uint8).astype(np.float32) data = data.reshape(num_images, image_size, image_size, 1) image = np.asarray(data[0]).squeeze() plt.imshow(image) plt.show() f = gzip.open('../data/MNIST/raw/t10k-labels-idx1-ubyte.gz', 'r') f.read(8) buf = f.read(1 * num_images) f.close() labels = np.frombuffer(buf, dtype=np.uint8) print("The first digit is ", labels[0])- gzip : gzip 압축 파일(
.gz)을 읽기 위한 표준 라이브러리. MNIST 데이터는 보통.gz형태로 배포됨. - np.frombuffer :
buf(바이트 덩어리)를 NumPy 배열로 변환 - .squeeze() :
- 크기가 1인 차원 제거
(28, 28, 1)→(28, 28)
- gzip : gzip 압축 파일(
K-means Clustering
from sklearn.cluster import KMeans
kmeans = KMeans(init="random", n_clusters=20, n_init=10, max_iter=300, random_state=42)
flattened = data.reshape((10000, 28*28))
kmeans.fit(flattened)

clusters =[[] for i in range(20)]
for pred, label in zip(kmeans.labels_, labels):
    clusters[pred].append(label)
print("The first 10 samples of the first cluster are ", clusters[0][0:10], ".")

bins, _, _ = plt.hist(clusters[0])
digit = np.argmax(bins)
print("The most common digis in cluster 0 is ", digit)
Leave a Comment